The metrics that actually matter for promotional performance

Conversion rate is the metric everyone reports.
It's also the metric that tells you almost nothing about whether your promotions are generating revenue or incurring losses.
But a promotion that converts everyone at 20% off isn't a win if half of those customers would have bought anyway. You've just given away margin for no reason.
Your finance team already suspects this. The metrics below will help you prove them right, or, hopefully, prove them wrong.
Why the conversion rate alone is misleading
Conversion rate measures activity. It doesn't measure efficiency.
When you run a sitewide 15% off promotion, the conversion rate is likely to increase.
But that single number hides several essential questions:
- How many of those customers would have converted without the discount?
- Did you attract bargain hunters who'll never return at full price?
- Did you train your regular customers to wait for the next sale?
Many promotions are either inefficient or unprofitable, and many retailers struggle to determine which ones.
The problem isn't that the conversion rate is useless. It's that conversion rate without context is useless.
What you need are efficiency metrics: numbers that show whether promotions are causing conversions or simply subsidizing purchases that would have happened anyway.
Promotional cost as a percentage of revenue
This is the metric that finance actually cares about.
What it measures: How much margin you're giving away to generate sales.
How to calculate it: Total discount value ÷ Total revenue × 100
So if you discount £50,000 worth of products in a month and generate £500,000 in revenue, your promotional cost is 10% of revenue.
What's healthy: This varies by sector, but research from IMRG shows the average retailer generates 46% of revenue from full-price products, 30% from voucher codes, and 24% from regular discounts. If you're significantly above that 54% discounted share, you may have a discount dependency problem.
Warning signs:
- Promotional cost percentage is creeping up while revenue stays flat (you're discounting more to stand still)
- Promotional cost percentage is high during typically intense trading periods (you're discounting when you don't need to)
- The percentage varies wildly with no clear strategy behind it
The goal isn't necessarily to minimize this number—promotions exist for a reason. The goal is to understand it and control it deliberately rather than accidentally.
Conversion rate by customer segment
Aggregate conversion rate is an average. And averages hide the truth.
The same 15% discount affects different customer segments in entirely different ways:
New vs returning customers
Returning customers typically convert at 2-3x the rate of new visitors. They already trust you. They've bought before. Many of them don't need a promotional nudge to complete a purchase.
When you run a blanket promotion, you're often giving discounts to customers who would have paid full price, while potentially under-incentivizing hesitant new customers who might need more convincing.
High-intent vs low-intent visitors
Not all visitors are equally likely to make a purchase. Someone who has viewed three product pages, added items to the cart, and is now hovering over the checkout button is fundamentally different from someone who bounced in from a social ad 30 seconds ago.
Offering both the same option is akin to a doctor prescribing the same medicine to every patient.
(It might work, but mostly it doesn't, and it's pretty dangerous.)
What to track:
- Conversion rate for new customers with and without promotions
- Conversion rate for returning customers with and without promotions
- Conversion rate by visit depth (pages viewed, time on site)
- Conversion rate by traffic source
Example: Segment your Black Friday data. If returning customers converted at 8% with a 20% discount and historically convert at 6% at full price, the promotion only lifted conversion by two percentage points. For new customers who typically convert at a rate of 1.5%, the same promotion might have lifted them to 4%—a much bigger relative impact. The question becomes: could you have given returning customers less, or nothing at all?
This is where personalization becomes genuinely valuable. Not personalization for its own sake, but personalization that ensures promotional spend goes where it actually changes behaviour.
Average discount depth vs baseline conversion
Deeper discounts don't always produce proportionally better results.
This might be the most expensive assumption in eCommerce CRO: the belief that if 10% off is good, 20% off must be twice as good.
What to measure:
Plot your discount percentage against conversion rate for similar customer segments and products. You're looking for the point of diminishing returns: Where additional discounts stop producing additional conversions.
What you might find:
- 5% off produces 80% of the conversion lift that 15% off produces
- Free shipping outperforms a 10% discount despite costing you less
- Certain products don't need discounting at all
Research into consumer behaviour shows that almost two-thirds of shoppers are discount-oriented—but that doesn't mean they all need the maximum discount. Many will convert at a much lower threshold than you're currently offering.
The real question: What's the minimum effective discount for each segment?

Most eCommerce platforms now support A/B testing of offer values. The test that reveals your minimum effective discount is one of the highest-ROI experiments you can run.
Margin protection during promotional periods
Revenue spikes can mask profit erosion.
Black Friday might be your biggest revenue day. But is it your most profitable? For many retailers, the answer is no. Or at least "we're not entirely sure."
Metrics to track during promotional periods:
- Gross margin percentage (compared to non-promotional periods)
- Contribution margin per order
- Profit per visitor
- Customer acquisition cost during promotional periods vs normal trading
Why this matters:
If your margin drops from 45% to 25% during sale periods, you need to sell 80% more units just to make the same gross profit. That's a high bar.
The question isn't "did we hit our revenue target?" It's "Did we actually make more money, or were we just busier?"
Example: Compare your peak trading week in November to a typical October week. If November revenue was £2m at 28% margin and October was £800k at 44%, you made £560k gross profit in November vs £352k in October. That's good. But if the numbers were closer—say, £1.2m at 30% vs £800k at 44%—you'd have made £360k vs £352k. A lot more work for barely more profit.
This is where managing stock and inventory intersects with promotional strategy. If you're discounting to clear slow-moving inventory, that's a legitimate use of promotions. If you're discounting bestsellers during peak demand, you might be solving a problem that doesn't exist.
Cart abandonment recovery without universal discounting
The standard playbook: someone abandons their shopping cart, you email them a 10% discount.
The problem: customers learn this. They start abandoning because they know a discount is coming.
The most common response when consumers are asked about waiting for discounts is "always". The majority of shoppers will stay if they believe a discount is forthcoming.
Better metrics to track:
- Recovery rate by offer type (discount vs free shipping vs reminder only)
- Recovery rate by customer segment (is this a price-sensitive customer or just a distracted one?)
- Recovery rate with no incentive at all (this is the baseline you're trying to beat, not zero)
What you might discover:
Not everyone abandoning a cart has a price objection. Many have:
- Information gaps (unclear delivery times, return policies)
- Friction (complicated checkout, forced account creation)
- Distraction (life happened, they meant to come back)
- Comparison shopping (they're checking competitors)
A discount solves one of these problems. It doesn't solve the others.
The goal of optimizing cart abandonment isn't to maximize recovery at any cost. It's to maximize recovery at the right price—and for the right customers.
Building a promotional scorecard
Individual metrics are useful. A scorecard that combines them is what finance actually wants to see.
A simple framework:
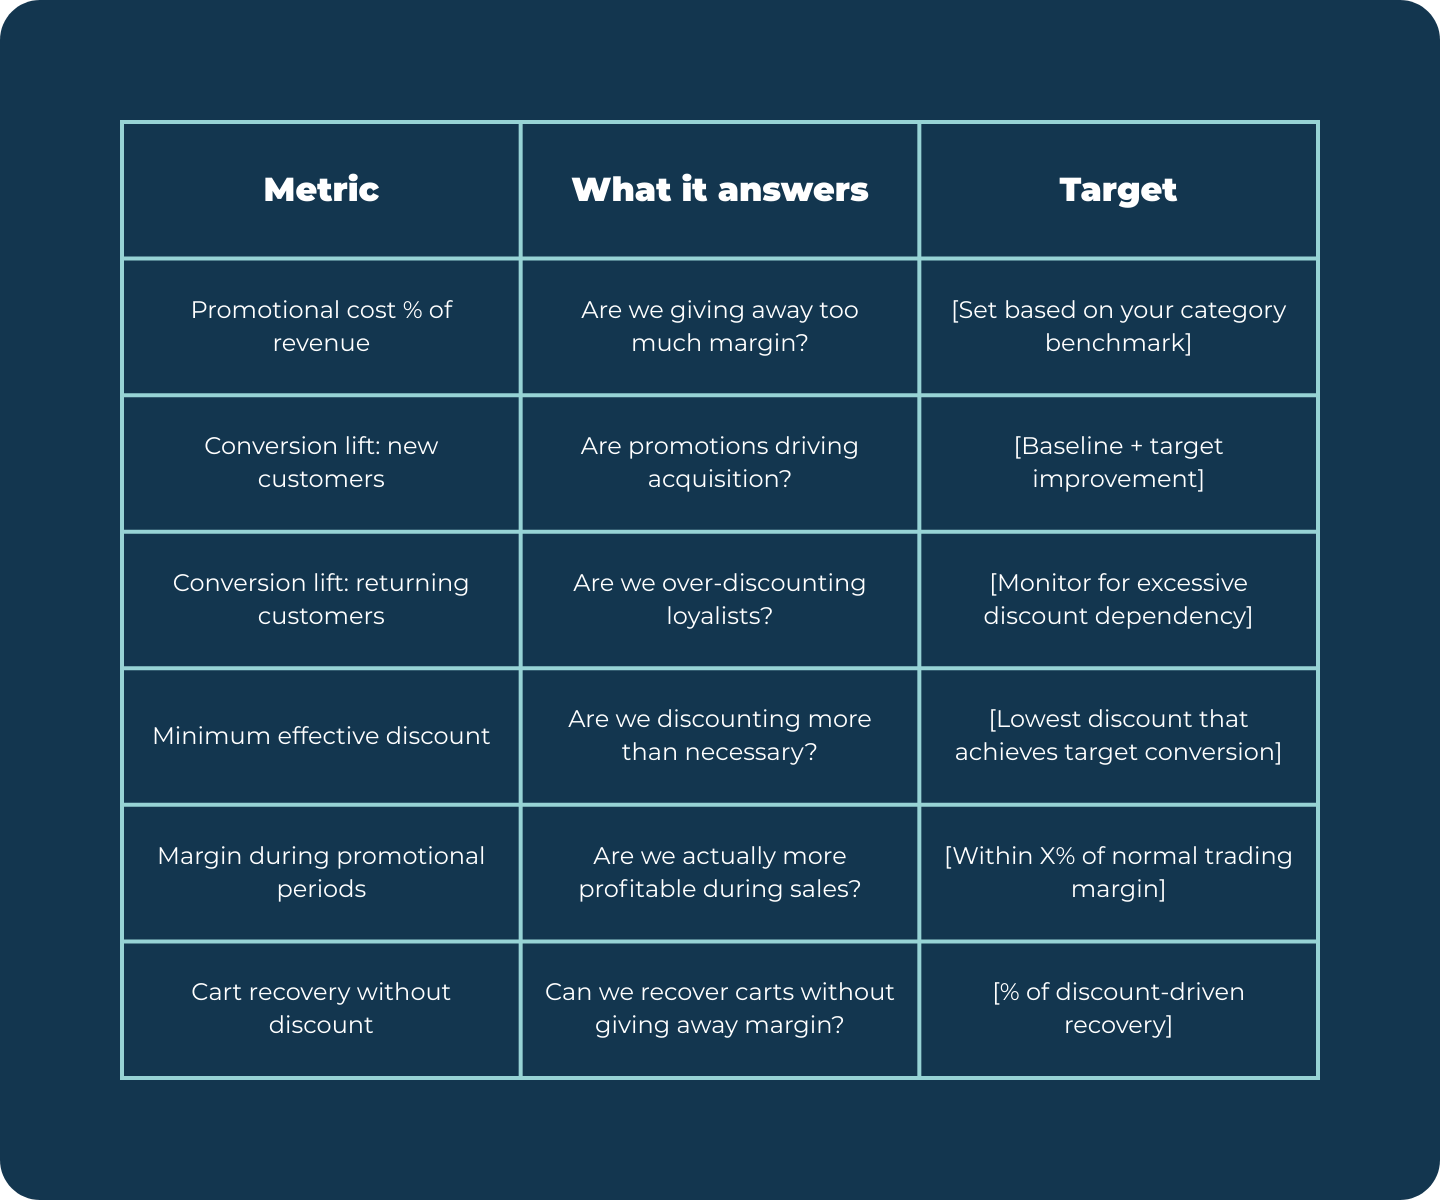
The shift here is from "did the promotion work?" to "did the promotion work efficiently?"
A promotion that drives 500 orders at 20% discount isn't automatically better than one that drives 400 orders at 10% discount. The second one might generate more profit.
What this means for your strategy
The best promotional strategies share a common trait: they treat discounts as a tool for solving specific problems, not a default response to any conversion challenge.
That means:
- Incentivizing new customers who need a nudge, not returning customers who don't
- Finding the minimum discount that changes behaviour, not the maximum discount you can afford
- Recovering abandoned carts through addressing real objections, not training customers to abandon
- Measuring profitability during promotional periods, not just revenue
When you present these metrics to finance, the conversation changes. You're no longer defending promotional spend. You're demonstrating promotional efficiency.
And that's a much easier conversation to have.